Scattered
Fifteen official sources, each with its own publication calendar, its own format and its own way of naming the same power plant.

Power market intelligence
The data model of the Chilean power sector, and the platform that makes it usable
Sector data is already public. The problem is that it sits across fifteen institutions, in PDFs, minutes and spreadsheets.
Why it exists
None of this is secret: the Coordinator publishes operations, the CNE publishes prices and capacity, the SEA publishes projects, Congress publishes its proceedings. But each institution publishes on its own schedule, in its own format and with its own naming. Following the market means checking fifteen different sites, every day, and reconciling them by hand.
Fifteen official sources, each with its own publication calendar, its own format and its own way of naming the same power plant.
Between 300 and 500 official documents a day: letters, failure analyses, resolutions, minutes and environmental filings, nearly all of them PDFs.
An online marginal cost is corrected to preliminary and then to final. A rule is amended. What was right yesterday no longer is.
A spreadsheet that has passed through three hands can no longer tell you where each number came from or which document backs it.
Galilei does that work once, every day, and delivers the result as modelled data and citable documents.
Where it comes from
The platform draws on the institutions that regulate, operate and supervise the system, plus the sector's press. Every data point keeps the link to its original publication, so any figure can be traced back to the document behind it.
Ingestion runs daily. When a source corrects what it published —a price stage moving from preliminary to final, a rule being amended— the model records the correction instead of overwriting it.
The platform
Six modules sit on top of the model. They are not separate products: they are six entry points to the same base, chosen by how much time you have and how specific the question is.
A system summary generated every morning: demand, marginal cost, renewable share and the news that moves the market.
Natural-language questions on prices, operations, market and regulation, answered with citations and a confidence level. On the web and over WhatsApp.
Semantic search across the document corpora: Coordinator letters, SEA filings, Panel of Experts, resolutions, bills and press.
Supply, price and market boards, with actual versus scheduled marginal cost, geographic analysis and ancillary services.
The model's datasets, explorable and queryable in natural language or SQL, with charting and export.
Keyword monitoring over the sources you choose, delivered by email at the frequency you set.
In detail
Below, a real deliverable from the platform. Then each module from the inside: those five screens reproduce the application's structure with illustrative data.
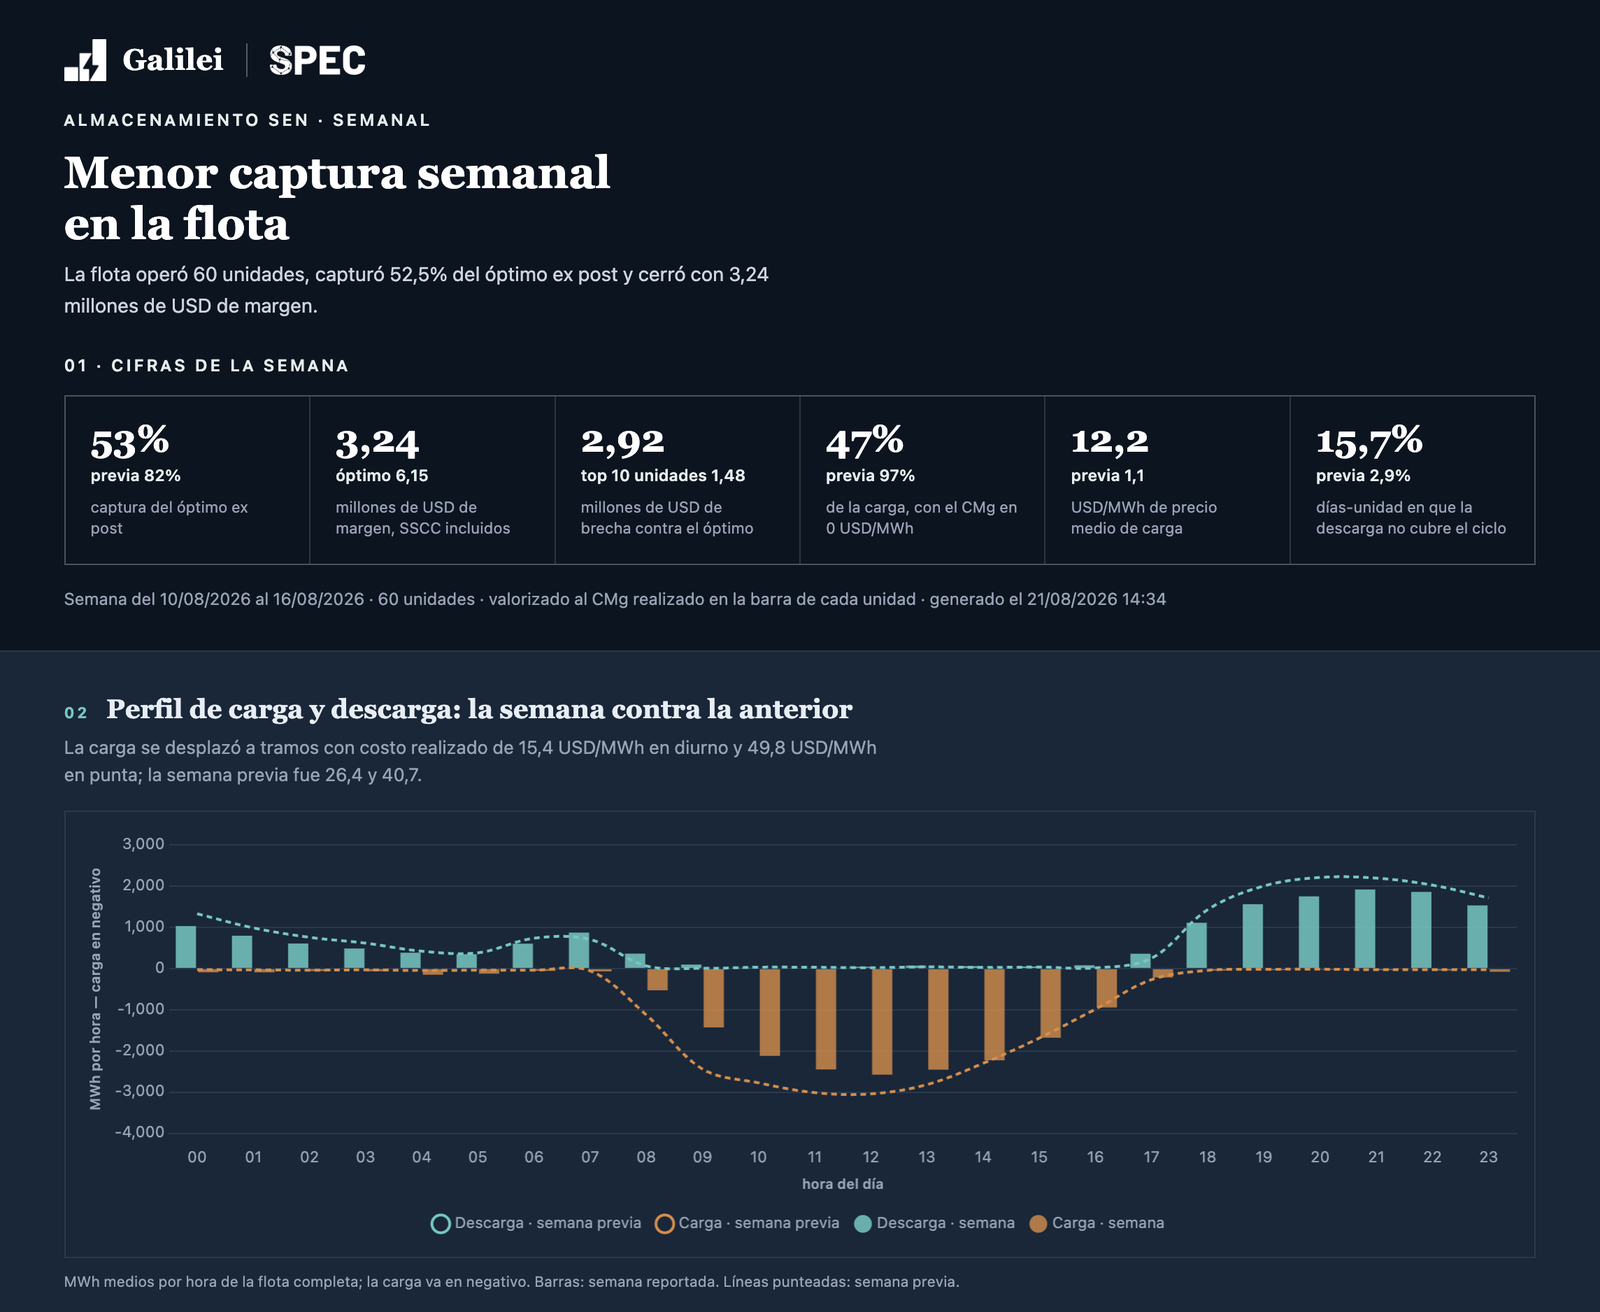
Every Monday, a report on how the SEN's battery fleet operated the week before: how much of the ex-post optimum it captured, what margin it closed with, how the charge and discharge profile moved against the previous week, and which units fell behind. It generates itself, on the same model that feeds the rest of the platform.
Every morning, before the day starts, a report with the previous day's indicators, an executive summary written by the model and the news classified by area. It arrives by email and stays in the app.
Executive summary
Marginal costs fell in the north on higher solar injection at midday. New storage capacity coming online moderated the evening peaks.
The same question you would ask an analyst. The answer brings the number, the context that explains it, the sources behind it and how reliable it is. Also available over WhatsApp, to ask from the field.
Average marginal cost at Crucero was 112 USD/MWh, 12.4% below the previous day, with a low of 34 USD/MWh at midday on higher solar injection.
Semantic rather than exact-match search: it finds the document even when you do not use the institution's own wording. Narrowed by corpus, date range and each source's own filters.
50 results found · 09-06 to 17-06-2026
Energy storage system and associated transmission line
The project consists of the construction, assembly and operation of a battery energy storage system of the BESS type…
Notice on marginal cost decoupling at northern busbars
Coordinated companies are informed regarding the treatment of decoupled hours and their effect on transfers…
Boards for what gets checked every week: marginal cost by busbar, actual versus scheduled, the spread between them, and the detail by year, week and busbar.
Marginal cost · Charrúa busbar · week 35
The model's full catalogue, with each dataset's description, its domain and when it was last loaded. From there you query, chart and export.
Installed capacity
Gross and net capacity, owner, technology, fuel and location for every plant in the system.
Last load: todayActual generation by unit
Hourly generation by generating unit, with technology, owner and capacity attached.
Data through: yesterdayMarginal cost by busbar
Actual and scheduled marginal cost by busbar and stage, with daily and monthly rollups.
Last load: todayOutages by event
Events declared by the Coordinator, distinguishing scheduled shutdowns from forced outages.
Data through: yesterdayUnderneath it all
The six modules would mean nothing without the layer holding them up. Galilei's real work is turning heterogeneous publications into three queryable layers, where every row and every paragraph keeps its origin.
62 modelled views
Series and registries already cleaned, denormalised and with unified naming: a power plant is called the same thing in generation, in capacity and in curtailment. Spread across 6 domains, with daily and monthly aggregations precomputed.
16 indexed corpora
Semantic search over the text of the sector's documents. 8 of those corpora have two tiers: the summary first, and if needed, the verbatim text of the source document.
Versioned legislation
Laws, decrees and DFLs reconstructed with their full history: the text in force, the text as of a past date, and the exact difference between both versions.
Coverage
Each domain is modelled at the grain its source publishes it in, not at a single one. Operations and prices arrive hour by hour; installed capacity is a snapshot; reservoirs are weekly. The matrix shows how many views sit at each intersection.
→ Scroll the matrix to see every column.
Grain matters more than it seems. A monthly average marginal cost hides exactly what you want to see: the zero-price hours at midday and the evening peaks.
One example
Marginal cost is not published once. It comes out online first, within the day; it is corrected to preliminary two or three days later; and it closes as final —the settlement value— seven to ten days after that. The model keeps all three stages separately, instead of keeping only the last.
The price observed while the system is operating.
First correction with metering consolidated.
The settlement value, the one that gets invoiced.
That is why a query can ask for «the best stage available» and always get the firmest figure for each hour, or ask for one specific stage and reproduce exactly what was known at the time.
How it reaches you
The web platform is one entry point, not the only one. The same model is consumed by email, by messaging and by direct integration with the team's own tools.
The six modules, with sessions and your own workspace.
Daily report and keyword alerts, at the frequency you set.
The assistant, to ask from the field without opening a laptop.
Programmatic access to the datasets, to feed your own models.
Integration
A generic AI assistant knows about the Chilean power market whatever it can read on the open web: it stays at the surface. Galilei is exposed as an MCP connector —the open standard an assistant uses to plug into a data source— and gives it depth: the hourly series, the letters, the failure analyses and the versioned legislation. You do not connect it for convenience; you connect it because without it your assistant never leaves the surface.
Querying Galilei
list_viewslocates the price and marginal-unit viewsquery_goldqueries CMg by busbar and hourquery_goldcross-checks the marginal technologyCrucero averaged 41 USD/MWh and Charrúa 58 in week 34. The decoupling concentrates between 11:00 and 16:00, when the north is set by solar and the centre-south is still set by natural gas.
The conversation happens in the assistant. The data comes from the model.
It installs as a connector in Claude or ChatGPT. The analyst asks in their own window and the assistant resolves it against the Chilean power market model.
Nothing to replicate, no downloads to keep from breaking. The connector queries the same model that feeds the platform, with the same freshness.
The same connector feeds the agents and applications your team builds: the model is available as a tool, not as a file somebody has to keep updating.
Every answer can cite the view or the document it came from. The number does not appear out of nowhere: it can be traced.
What it is used for
These are not features: they are the queries teams used to run by hand and now resolve in a single pass. What changes is not the analysis —your team still does that— but the data-gathering leg, which today eats most of the time.
How it works today
With Galilei
We walk you through the platform using the questions your team asks every week, and work out which part of the model is useful to you.